Quickstart (Cloud)
This walks through the shortest path from signing up to a working query on arcodash Cloud.
1. Create your account
Go to cloud.arcodash.com/signup and create an account and an organization. You land in an empty workspace — no connectors, no queries yet.
2. Connect a connector
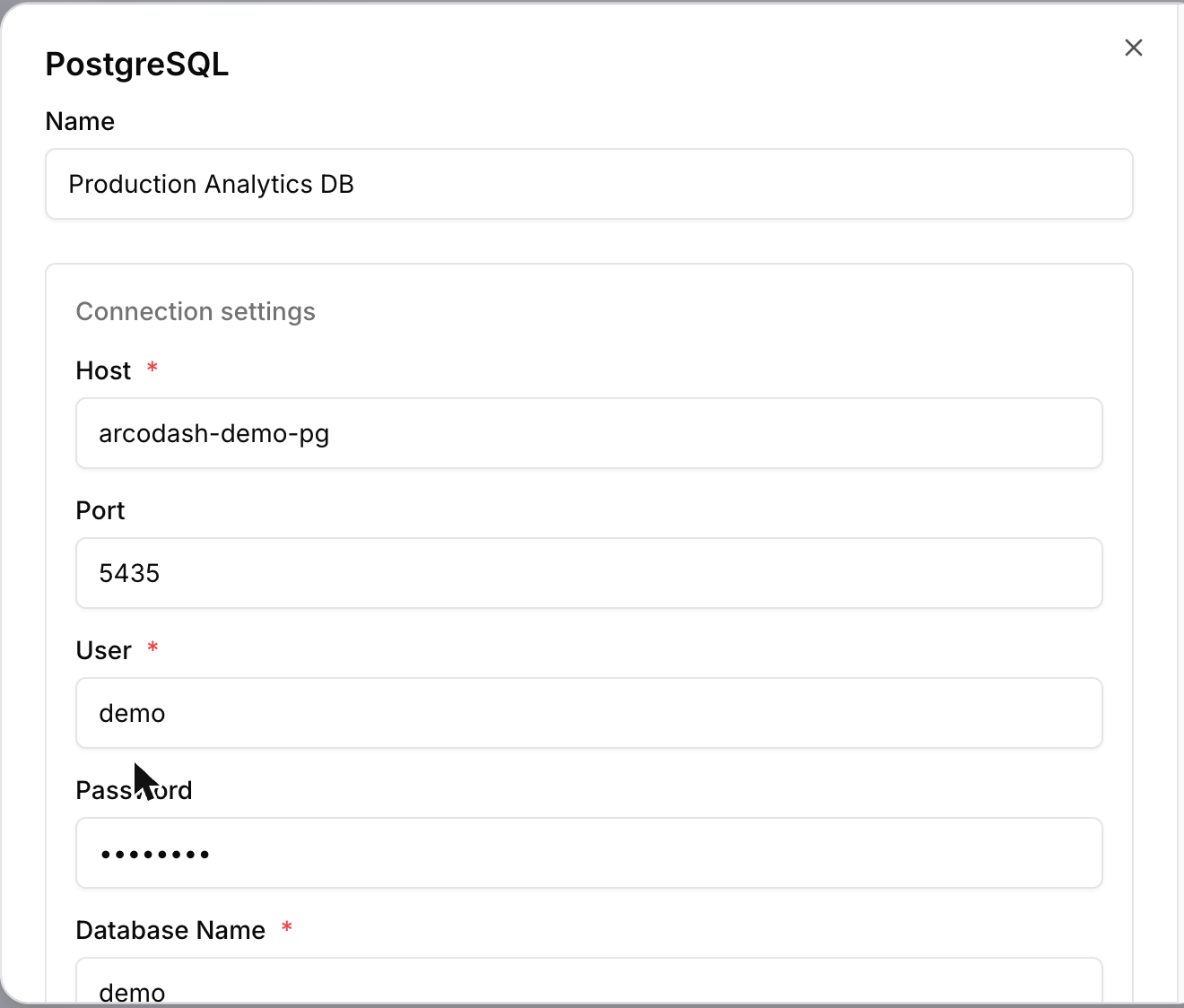
From the workspace, add a connector and choose its type. If you’re connecting Postgres, see the Postgres connector page for the exact fields it asks for; every other connector follows the same shape (host/credentials/database), just with connector-specific fields.
[!NOTE] Your database needs to be reachable from the internet, with SSL/TLS enabled. arcodash doesn’t currently publish a fixed set of outbound IP addresses to allowlist — if your database’s firewall only allows specific IPs in, you’ll need another way to open it up (a broader CIDR range, or a connection method your provider supports for that case).
3. Write and run a query
Open the query editor, pick the connector you just connected, and write SQL. Execute it — the result shows as a table by default.
[!TIP] Reference a parameter with
{{ param_name }}anywhere in your SQL. arcodash renders an input for it above the editor, so the same saved query becomes reusable across different filter values instead of being copy-pasted per value.
You don’t have to start from a blank editor: if your organization’s admin has configured an AI provider, the Ask with AI tab next to the SQL editor turns a plain-English question into a SQL draft for you to review and run. See AI-assisted SQL generation.
4. Turn it into a chart, then a dashboard
From the query result, add a visualization — line, bar, area, pie, scatter, a counter, or a funnel — then add that visualization to a dashboard. Dashboards arrange visualizations on a grid and can carry their own parameters that filter every widget on the page at once.
5. Share it
Share the dashboard with specific users or groups, or generate a public secret-token link if it needs to go outside your organization. Both the query and the dashboard support per-object sharing independently.
6. Get alerted when the data breaks
Any saved query can carry a monitor — a threshold check on one column of its result that notifies email, Slack, or another destination when it trips. Combined with a schedule, that’s also how data-health checks work: a query that measures freshness, row count, null rate, or duplicates, plus a monitor on the number it returns. See Alerts overview and Data observability monitors for the recipes.
Where to go next
- Core concepts — how queries, visualizations, dashboards, and monitors relate to each other.
- Connecting data — every connector and its exact connection fields.
- API reference — automate what you just did by hand.
- Troubleshooting — connection test failures and other common snags.