Data observability monitors
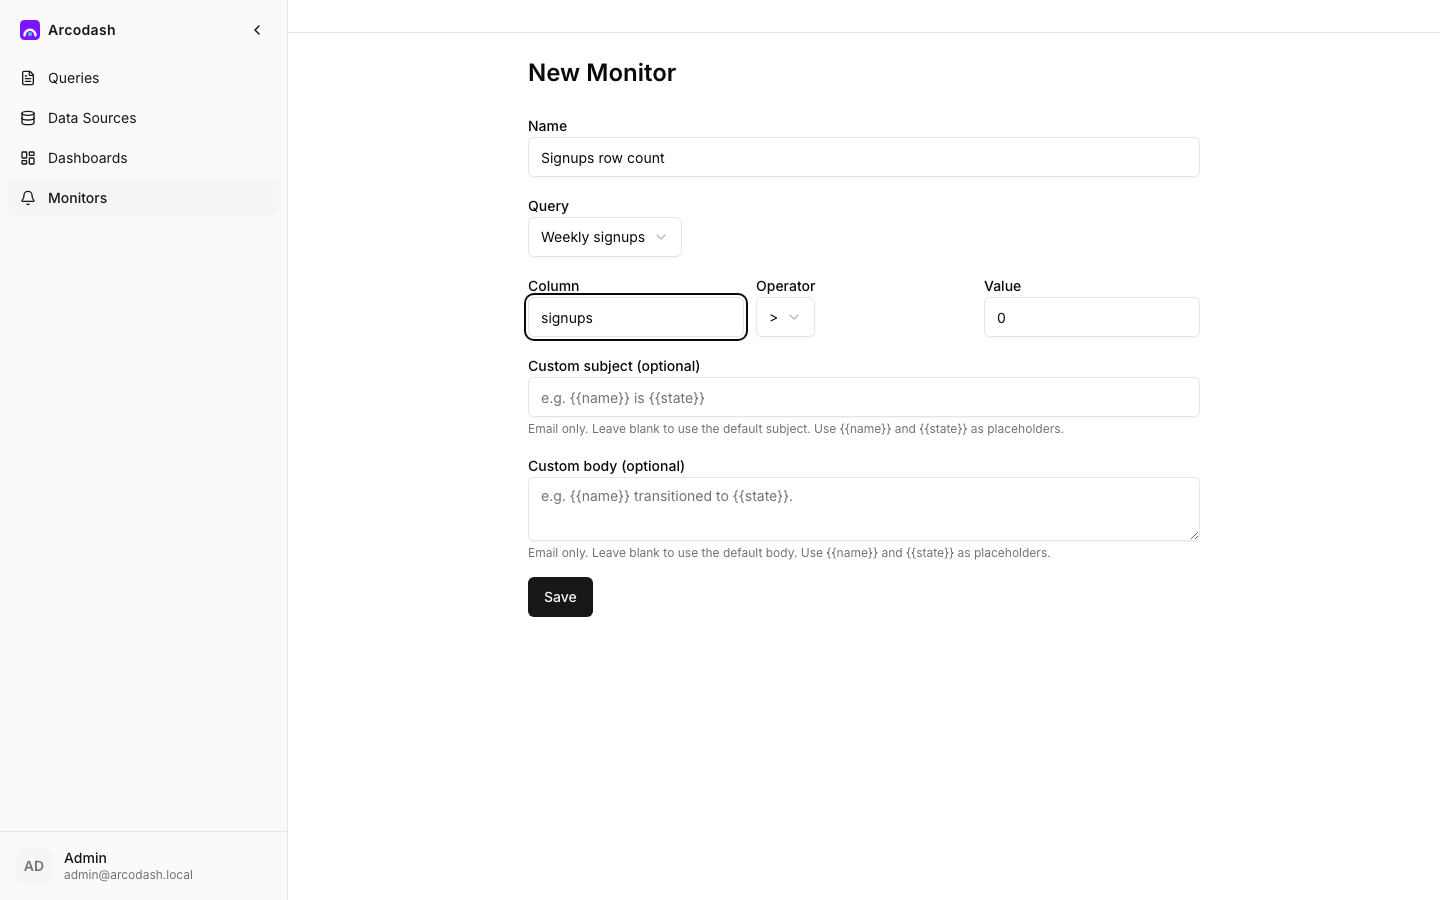
arcodash has one monitor mechanism: a threshold check on one column of a saved query’s result. “Data observability monitor” isn’t a separate kind of monitor in the product — it’s four common questions people ask about their data, each answered by writing the right query and pointing a regular monitor at it. This page is the recipe for each.
[!NOTE] There’s no dedicated “check type” picker for these four — you write the query yourself and attach a plain column/operator/value monitor to it, same as any other alert. If you’re used to a tool that has a one-click freshness/row-count/duplicates wizard, the equivalent here is these four query shapes below plus the monitor you’d build for any other threshold — or the AI suggestions described in Let AI draft the checks below.
How a check is evaluated
Every check here works because each recipe’s query is written to return exactly one row — a monitor only ever reads the first row of its query’s result, pulls the named column out of it, and compares that single value against the threshold. It never scans every row looking for one that matches.
That’s why each query below aggregates down to a single number (count(*), max(...), a
percentage) instead of returning one row per record. If you write a monitor query that can return
more than one row, order it (and LIMIT 1 it, if needed) so the row that actually matters is
always first — a monitor never checks anything but row one, silently, with no error to tell you
rows two and onward were ignored.
Freshness
“Has this table been updated recently?” Write a query that returns how long ago the newest row was written, e.g.:
SELECT extract(epoch from now() - max(created_at)) AS seconds_since_last_row FROM events;Monitor the seconds_since_last_row column with > and a threshold in seconds (e.g. 3600 for
“alert if nothing’s landed in the last hour”). Put the query on a schedule so this check runs
without anyone opening it — see Scheduled refresh.
Row count
“Did today’s load actually produce roughly the expected number of rows?” — catches a silently truncated or empty load, not just a missing one.
SELECT count(*) AS row_count FROM orders WHERE created_at::date = current_date;Monitor row_count with < and a floor value tuned to what a normal day looks like. Consider a
generous floor rather than an exact expected count — the point is catching “way off,” not
flagging ordinary day-to-day variance.
Null rate
“Is a column that should always be populated silently going empty?”
SELECT
  100.0 * count(*) FILTER (WHERE email IS NULL) / nullif(count(*), 0) AS null_pct
FROM users;
Monitor null_pct with > and a small tolerance (e.g. 1 for “alert if over 1% of rows have a
null email”), rather than != 0, since a handful of legitimately-null rows is often normal.
Duplicates
“Did something upstream insert the same record twice?”
SELECT count(*) AS dup_count
FROM (SELECT order_id, count(*) FROM orders GROUP BY order_id HAVING count(*) > 1) t;
Monitor dup_count with > and 0 — any duplicate at all is usually worth knowing about, unlike
row count and null rate where a small nonzero value is often fine.
Let AI draft the checks
If your organization has an AI provider configured (see AI provider configuration), you don’t have to write these queries by hand. Every connector’s detail page has a Data quality checks card: pick the tables to cover (or all of them) and Suggest checks with AI proposes checks like the recipes on this page, built from the connector’s schema — table and column names, with declared column types where the connector reports them; never row data.
Accepting a suggestion creates the query, publishes it, creates the monitor on it, and subscribes you — from there it’s an ordinary monitor: review its threshold, and put its query on a schedule so the check runs without anyone opening it. Tables that already have checks are reported as covered rather than suggested again.
Choosing thresholds
Every one of these is the same shape: pick a column that goes wrong in an obvious direction, and set a threshold with enough margin that normal variation doesn’t trigger it constantly. Start looser than you think you need — a monitor nobody trusts because it cries wolf gets muted and ignored, which defeats the point. Tighten the threshold once you’ve watched it run clean for a while.
Where to go next
- Alerts overview — the underlying threshold mechanism, state machine, and rearm behavior these four checks all use.
- Notification destinations — where a triggered check gets sent.